< < TM04 : TM04 : TM04 > >

TM04: Fully Traffic Responsive

The fully traffic responsive implementation offered in TM03 is extended with Connected Vehicle Roadside Equipment installed at the intersection that supports real-time communications between the intersection and approaching vehicles. Detailed status is collected from approaching vehicles and real-time intersection status is provided so that approaching and queued vehicles can optimize their intersection use. In this more advanced implementation, signal timing is based on data collected from approaching vehicles and/or traditional infrastructure-based detectors.

Relevant Regions: Australia, Canada, European Union, and United States

Enterprise

Development Stage Roles and Relationships

Installation Stage Roles and Relationships

Operations Stage Roles and Relationships
(hide)

Source Destination Role/Relationship

Maintenance Stage Roles and Relationships

Functional

This service package includes the following Functional View PSpecs:

Physical Object Functional Object PSpec Number PSpec Name

Physical

The physical diagram can be viewed in SVG or PNG format and the current format is SVG.

Physical diagrams have not been developed for this application yet.
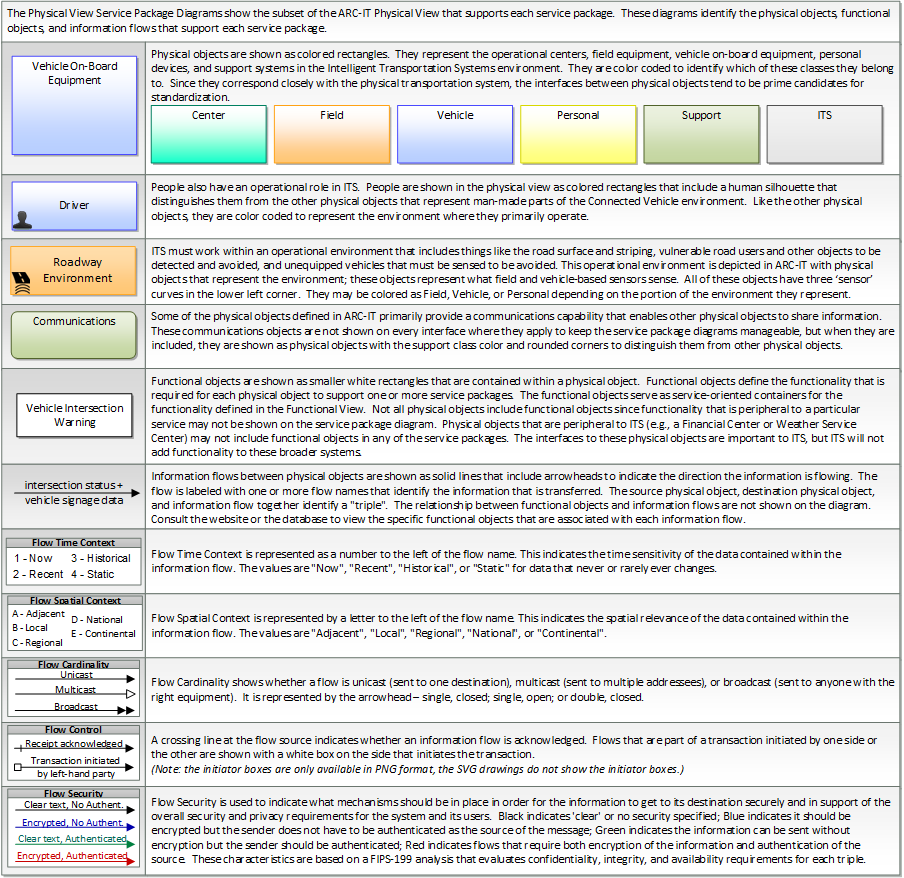

Display Legend in SVG or PNG

Includes Physical Objects:

Physical Object Class Description

Includes Functional Objects:

Functional Object Description Physical Object

Includes Information Flows:

Information Flow Description

Goals and Objectives

Associated Planning Factors and Goals

Planning Factor Goal
A. Support the economic vitality of the metropolitan area, especially by enabling global competitiveness, productivity, and efficiency; Improve freight network
D. Increase the accessibility and mobility of people and for freight; Reduce congestion
E. Protect and enhance the environment, promote energy conservation, improve the quality of life, and promote consistency between transportation improvements and State and local planned growth and economic development patterns; Protect/Enhance the Environment
G. Promote efficient system management and operation; Improve efficiency
I. Improve the resiliency and reliability of the transportation system and reduce or mitigate stormwater impacts of surface transportation; Improve resiliency and reliability

Associated Objective Categories

Objective Category
Arterial Management: Delay
Arterial Management: Reliability
Arterial Management: Traffic Monitoring and Data Collection
Arterial Management: Traffic Signal Management
Special Event Management: Entry/Exit Travel Times
Special Event Management: Use of Technology
System Efficiency: Cost of Congestion
System Efficiency: Delay
System Efficiency: Duration of Congestion
System Efficiency: Energy Consumption
System Efficiency: Extent of Congestion
System Efficiency: Intensity of Congestion (Travel Time Index)
System Efficiency: Travel Time
System Reliability: Non-Recurring Delay
System Reliability: Planning Time Index
System Reliability: Travel Time 90th/95th Percentile
System Reliability: Travel Time Buffer Index
System Reliability: Variability
Transit Operations and Management: Transit Signal Priority
Travel Weather Management: Signal Timing Plans

Associated Objectives and Performance Measures

Objective Performance Measure
Annual rate of change in regional average commute travel time will not exceed regional rate of population growth through the year Y. Average commute trip travel time (minutes).
Crash data for all arterials in the region is reviewed every X years to determine if signal adjustments can be made to address a safety issue. Number of years between reviews of crash data on all arterials for possible signal timing impacts.
Decrease delay by X percent per year by increasing the use of queue jumping and automated vehicle location. Travel time delay on routes with queue jumping and automated vehicle location in use.
Decrease system-wide signal delay on transit routes by X percent per year. System-wide signalized stop delay on transit routes.
Decrease the average buffer index for (multiple routes or trips) by X percent over Y years. The buffer index represents the extra time (buffer) most travelers add to their average travel time when planning trips. This is the extra time between the average travel time and near-worst case travel time (95th percentile). The buffer index is stated as a percentage of the average travel time. Average buffer index or buffer time can be calculated using miles traveled as a weighting factor. Buffer time = 95th percentile travel time (min) – average travel time (min).
Decrease the buffer index for (specific travel routes) by X percent over the next Y years. The buffer index represents the extra time (buffer) most travelers add to their average travel time when planning trips. This is the extra time between the average travel time and near-worst case travel time (95th percentile). The buffer index is stated as a percentage of the average travel time. Average buffer index or buffer time can be calculated using miles traveled as a weighting factor. Buffer time = 95th percentile travel time (min) – average travel time (min).
Decrease the seconds of control delay per vehicles on arterial roads by X percent in Y years. (Control delay is defined as the portion of the total delay attributed to traffic signal operation for signalized intersections). Control delay seconds per vehicle.
Implement special event traffic signal timing plans at X percent of major special events each year beginning in year Y. Percent of major special events each year in which a special event traffic signal timing plan was implemented.
Improve average travel time during peak periods by X percent by year Y. Average travel time during peak periods (minutes).
Increase the miles of arterials in the region operating at level of service (LOS) Z by X percent in Y years. Percent of arterial miles in region operating at LOS Z.
Increase the number of intersections running in a coordinated, closed-loop, or adaptive system by X percent in Y years. Number of intersections running in a coordinated, closed-loop, or adaptive system.
Increase the percent of major special events using ITS-related assets (e.g., roadside cameras, dynamic message signs, vehicle speed detectors) to detect and manage special event entry/exit bottlenecks and incidents by X percent in Y years. Percent of special events using ITS-related assets to detect and manage incidents/bottlenecks at entry/exit routes of the events.
Maintain a program of evaluating X percent of signals for retiming every Y years. Number of traffic signals evaluated for retiming.
Maintain the rate of growth in facility miles experiencing recurring congestion as less than the population growth rate (or employment growth rate). Percent of lane-miles (or rail) operating at LOS F or V/C > 1.0
Reduce average time to clear event's exiting queue by X percent in Y years. Average time to clear event's exiting queue by year per event.
Reduce average travel time into and out of the event by X percent in Y years. Average travel time away from selected special events to a set of locations over a year.
Reduce average travel time into and out of the event by X percent in Y years. Average travel time to selected special events from a set of locations in the area over a year.
Reduce buffer index on arterials during peak and off-peak periods by X percent in Y years. The buffer index (represents the extra time (buffer) travelers add to their average travel time when planning trips in order to arrive on-time 95 percent of the time).
Reduce buffer time index for travelers to multiple similar special events by X percent in Y years. Buffer time index for travelers to multiple similar special events.
Reduce delay associated with incidents on arterials by X percent by year Y. Hours of delay associated with incidents.
Reduce excess fuel consumed due to congestion by X percent by year Y. Excess fuel consumed (total or per capita).
Reduce hours of delay per capita by X percent by year Y. Hours of delay (person-hours).
Reduce hours of delay per capita by X percent by year Y. Hours of delay per capita.
Reduce hours of delay per driver by X percent by year Y. Hours of delay (person-hours).
Reduce hours of delay per driver by X percent by year Y. Hours of delay per driver.
Reduce non-special event VMT in the event area during events by X percent in Y years. Non-special event VMT in the event area during events over a year.
Reduce the 90th (or 95th) percentile travel times for each route selected by X percent over Y years. 95th or 90th percentile travel times for selected routes.
Reduce the annual monetary cost of congestion per capita for the next X years. Cost (in dollars) of congestion or delay per capita.
Reduce the average buffer time needed to arrive on-time for 95 percent of trips on (specified routes) by X minutes over Y years. The buffer index represents the extra time (buffer) most travelers add to their average travel time when planning trips. This is the extra time between the average travel time and near-worst case travel time (95th percentile). The buffer index is stated as a percentage of the average travel time. Average buffer index or buffer time can be calculated using miles traveled as a weighting factor. Buffer time = 95th percentile travel time (min) – average travel time (min).
Reduce the average of the 90th (or 95th) percentile travel times for (a group of specific travel routes or trips in the region) by X minutes in Y years. 95th or 90th percentile travel times for selected routes.
Reduce the average planning time for (specific routes in region) by X minutes over the next Y years. The planning time index represents the time that must be added to travel time at free-flow speeds or the posted speed limit to ensure on time arrivals for 95 percent of the trips. Planning time = 95th percentile travel time (minutes) – Travel time at free-flow speed or posted speed limit. Average planning time index or planning time can be computed using a weighted average over person miles traveled.
Reduce the average planning time index for (specific routes in region) by X (no units) over the next Y years. The planning time index represents the time that must be added to travel time at free-flow speeds or the posted speed limit to ensure on time arrivals for 95 percent of the trips. Planning time = 95th percentile travel time (minutes) – Travel time at free-flow speed or posted speed limit. Average planning time index or planning time can be computed using a weighted average over person miles traveled.
Reduce the number of hours per day that the top 20 most congested roadways experience recurring congestion by X percent by year Y. Hours per day at LOS F or V/C > 1.0 (or other threshold).
Reduce the percentage of facility miles (highway, arterial, rail, etc.) experiencing recurring congestion during the peak period by X percent by year Y. Percent of lane-miles (or rail) operating at LOS F or V/C > 1.0
Reduce the regional average travel time index by X percent per year. Travel time index (the average travel time during the peak period, using congested speeds, divided by the off-peak period travel time, using posted or free-flow speeds).
Reduce the share of major intersections operating at LOS Z by X percent by year Y. Percent of intersections operating at LOS F or V/C > 1.0
Reduce the variability of travel time on specified routes by X percent during peak and off-peak periods by year Y. Variance of travel time. Variance is the sum of the squared deviations from the mean. This can also be calculated as the standard deviation of travel time. Standard deviation is the square root of variance.
Reduce total energy consumption per capita for transportation by X percent by year Y. Total energy consumed per capita for transportation.
Reduce total fuel consumption per capita for transportation by X percent by year Y. Total fuel consumed per capita for transportation.
Reduce total person hours of delay (or travel-time delay per capita) by time period (peak, off-peak) caused by all transient events such as traffic incidents, special events, and work zones. Total person hours of delay during scheduled and/or unscheduled disruptions to travel.
Reduce total person hours of delay (or travel-time delay per capita) by time period (peak, off-peak) caused by scheduled events, work zones, or system maintenance by x hours in y years. Travel time delay during scheduled and/or unscheduled disruptions to travel.
Reduce total person hours of delay (or travel-time delay per capita) by time period (peak, off-peak) caused by unscheduled disruptions to travel. Total person hours of delay during scheduled and/or unscheduled disruptions to travel.
Special timing plans are available for use during freeway incidents, roadway construction activities, or other special events for X miles of arterials in the region by year Y. Number of miles of arterials that have at least one special timing plan for incidents, construction, or events.
Special timing plans are available for use during inclement weather conditions for X miles of arterials in the region by year Y. Number of miles of arterials that have at least one special timing plan for inclement weather events.
X percent of intersections in the region are equipped and operating with traffic signals that enable real-time monitoring and management of traffic flows by year Y. Percent of intersections in the region equipped and operating with traffic signals that enable real-time monitoring and management of traffic flows.


Since the mapping between objectives and service packages is not always straight-forward and often situation-dependent, these mappings should only be used as a starting point. Users should do their own analysis to identify the best service packages for their region.

Needs and Requirements

Need Functional Object Requirement

Related Sources

  • None


Security

In order to participate in this service package, each physical object should meet or exceed the following security levels.

Physical Object Security
Physical Object Confidentiality Integrity Availability Security Class
Security levels have not been defined yet.


In order to participate in this service package, each information flow triple should meet or exceed the following security levels.

Information Flow Security
Source Destination Information Flow Confidentiality Integrity Availability
Basis Basis Basis
Security levels have not been defined yet.

Standards

Currently, there are no standards associated with the physical objects in this service package. For standards related to interfaces, see the specific information flow triple pages.


Needs and Requirements

Need Functional Object Requirement

System Requirements

No System Requirements